plotting in matlab
这一页封面策划的功能2Dand3Dcurves inmatlab. It coversplotandplot3functions.
plot and plot3 matlab code
clc;clear all;close all;
x=[1 2 3 4 5 6 7 8 9 10];
y=[0.1 0.2 0.3 0.4 0.5 0.35 0.25 0.15 0.05 0.02];
z=[10 20 30 40 50 60 70 80 90 100];
figure;plot(x,y);
figure;plot3(x,y,z);
x=[1 2 3 4 5 6 7 8 9 10];
y=[0.1 0.2 0.3 0.4 0.5 0.35 0.25 0.15 0.05 0.02];
z=[10 20 30 40 50 60 70 80 90 100];
figure;plot(x,y);
figure;plot3(x,y,z);
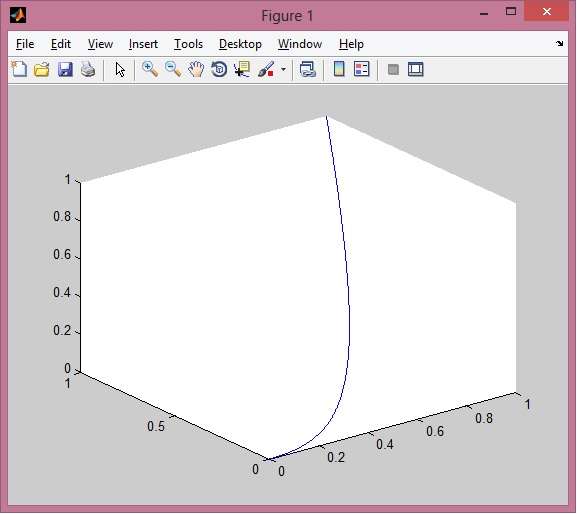
Another plot3 code
clc;clear all;close all;
t=linspace(0,1,1000);
x=t;
y=t.^2;
z=t.^3;
plot3(x,y,z);
t=linspace(0,1,1000);
x=t;
y=t.^2;
z=t.^3;
plot3(x,y,z);
Output

The other matlab function is stem3(x,y,z) to plot in 3D.
Useful Links to MATLAB codes
Refer following as well as links mentioned on left side panel for useful MATLAB codes.
OFDM Preamble generationTime off estimation corrFreq off estimation corrchannel estimation11a WLAN channelPN sequence generationOFDMA Tx RxAES DEScarrier aggregationCCDFFIR FilterIIR FilterLow Pass FIRViterbi decoderCRC8 CRC32
RF and Wireless tutorials
WLAN802.11ac802.11adwimaxZigbeez-waveGSMLTEUMTSBluetoothUWBIoTsatelliteAntennaRADAR